
Education leaders love data. Ideas, projects, and initiatives move with data behind them. The school library is one of the best places to collect what I call “happy data.” As a school librarian, you can collect data easier than most in the school. How? By acknowledging how the school is using the library. It doesn’t have to be complicated. I knew that my administration loved data. And frankly, so do I. As someone who worked in mental health prior to coming to library sciences, studies were familiar territory. Blending two types of studies—quantitative and qualitative— together allowed me to really get a handle on where the library was at in its current moment. Here are a few ways I was able to use data to make improvements in the libraries I led.

1 Study Your Clientele
Like any small business owner would do, I studied my clientele. I spoke with teachers about how the library had been used prior to my arrival as the librarian. I watched how students moved in the hallways near my library, and how they were accustomed to using—or trying to use—the library. I often polled the staff and students using two different Google forms, one for each respective population.
2 Conduct a Collection Analysis
It’s important to know what you currently have in your collection and how the titles you have will serve the students and staff you have just studied. Viewing where my existing collection stood through a comprehensive Collection Analysis (which Mackin offers) really synthesized well with the data that I was collecting on the ground too.

3 Involve Your Students
I knew that one of the school libraries I worked at needed some “refreshing.” I worked with the “Introduction to Interior Design” class in the Family And Consumer Sciences (FACS) department. The teacher and I collaborated on making the library the final project for that class. The students created presentations with color palettes and flow designs for the library. The class, along with a few staff and administration, voted which design worked best for the space and the students’ design was used. And because I had student input and data, the superintendent loved the idea! Having stakeholders on Team Library can move mountains!
4 Create Data Displays
Recording and showcasing data for the school community is a way to celebrate the improvements you are making in your library. One way I did this was to create monthly reports.
Try starting with your circulation systems. More than likely it has an option to run reports. Circulation systems collect data each time a title is checked out from your school library. Do you manage the textbooks in addition to the library books? That is also useful data. Below is an example of some data from a November library report that I collected from a high school library.
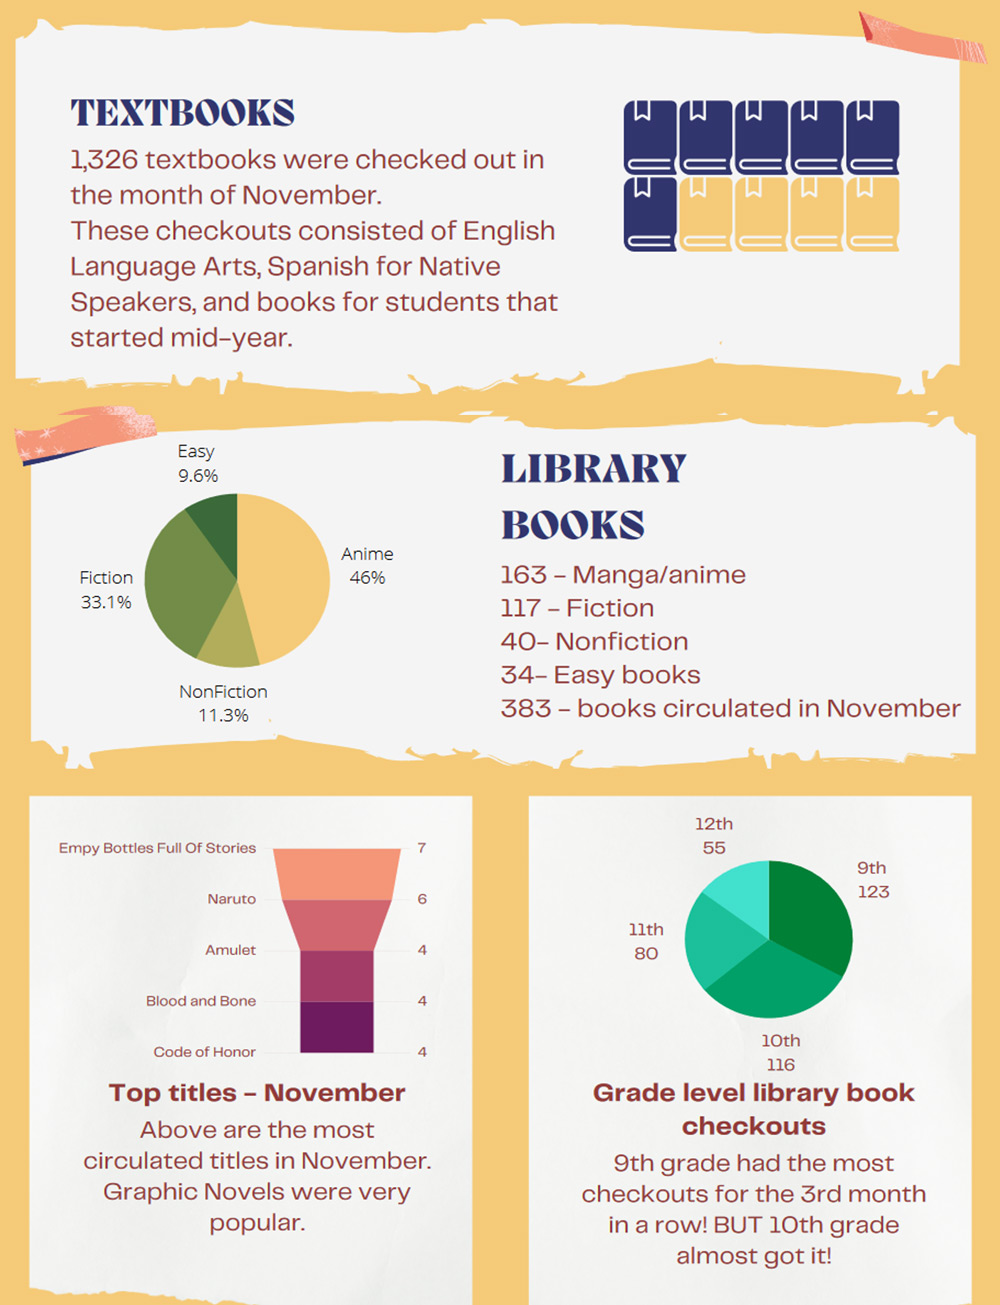
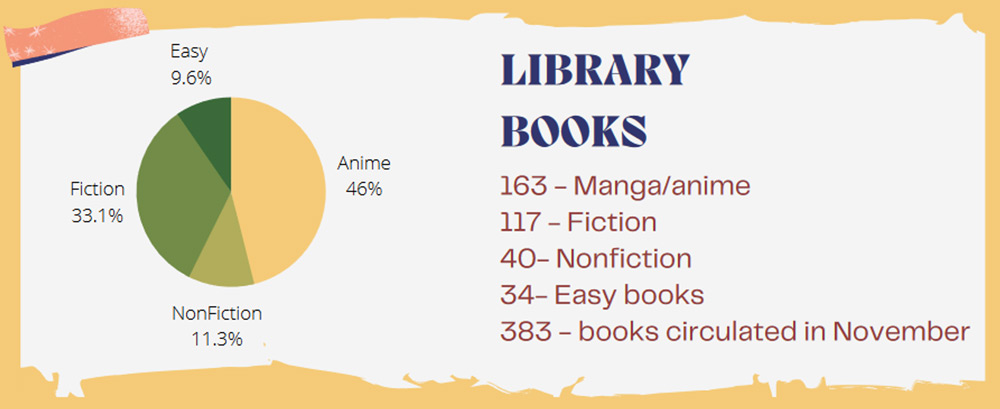
Capturing the data and then putting it into a bright and easy to decipher graphic is a key way that you can show your school’s community how the library is being used. There are plenty of free sites that you can sign up for that will make cute snapshot of the data. Google Drive, a favorite amongst many school districts, also has a way to make infographics with editable data fields that you can simply input new data every month, quarter, semester, or however you deem most appropriate to record. Two of my favorites are Canva (which has free teacher accounts available) and Infogram.

5 Use Data to Create Competition
I began to see the value in the data that was readily available at my fingertips. Every month I made a report and I simply dropped it in the mailbox of administration. Keep a copy of each report in a binder for yourself too. That way when you are getting observed (like most school librarians do) and asked how you support your teachers, you can whip out the notebook. Go ahead and leave one where students will see it in the library as well. Notice on the grade-level library book checkouts how I created interest for 10th grade to compete to check out more books than 9th grade.
Want more ideas? Do you have classes that visit the library every week? There were some teachers who loved to bring their classes to the library at one high school library where I worked. And once other teachers saw their teacher friends doing that, then more and more wanted to book time in the library (pun intended). That drove my checkout numbers up! And since they visited every week or every other week, it also drove up the number of class visits to the library as well. Students fell in love with their school library once again! Because more often than not, high school students spend less time in the school library than elementary or middle school students because library classes typically aren’t scheduled. But you can right that wrong and schedule teachers according to what works best for them and for you.
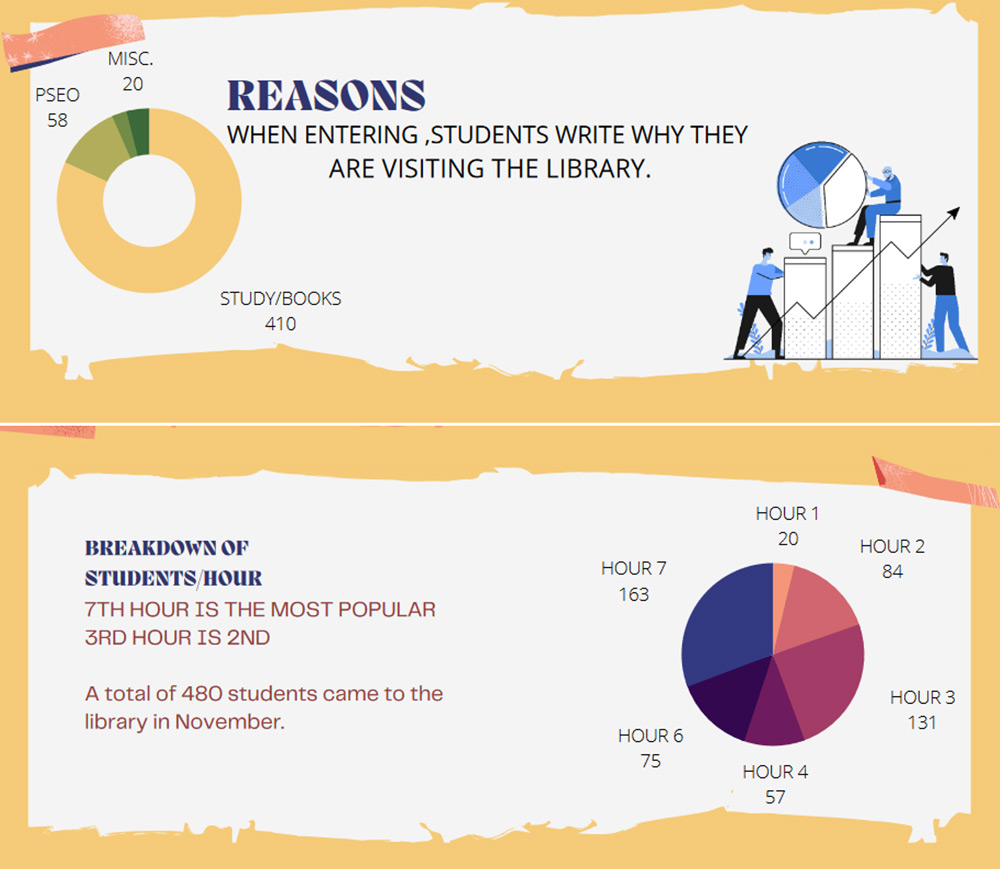
There are a multitude of additional ways to collect data. When students enter your space, do they sign in? That’s data. I had student helpers that worked in the library. Sometimes those students had the dismal job of counting and making a million tally marks from the sign-in sheets, but they were providing vital data. And once I showed the student helpers how I was using the data, they were more than willing to count the information on the sheets. From a sign-in sheet, I was able to collect data on the following: grade, hour/period, their reason for being in the library (give options for them to circle), and what teacher they were coming from. At the end of the report, consider sharing any great library news!


